Investment Memo
data centres thesis Q1 2026
Why the compute trade moved from chips to powered clusters, and where CRWV, NBIS and IREN can still break.
31 May 2026 · YK Research
Contents
Bottom Line
My ranking by cluster quality today is CoreWeave, then Nebius, then IREN. My ranking by risk-adjusted strategic asset quality is Nebius, then CoreWeave, then IREN. CoreWeave has the best operating proof and the hardest capital stack. Nebius has the cleanest owned-power and software-platform blend, with less discovery value after the 13G. IREN has the cheapest optionality and the largest proof gap on commissioning, uptime, support and cloud-quality execution.
The key correction: Leopold's Q1 2026 13F showed CoreWeave, IREN, Core Scientific, Applied Digital, Bloom and SanDisk. Nebius was disclosed after quarter-end via Schedule 13G. The sequence matters: physical bottlenecks first, then a concentrated full-stack AI-cloud stake.
Short Primer: What An AI Data Center Actually Is
An AI data center is closer to an industrial plant than an office building with servers. The product is reliable compute delivered at scale. The investable chain runs from power rights and construction through electrical equipment, cooling, semiconductors, servers, networking, storage, orchestration and the customer interface.
| Layer | What it includes | Investment read |
|---|---|---|
| Site and power | Land, grid interconnect, substations, transformers, backup power, power purchase agreements and permitting. | The biggest lead-time risk. A GPU order can arrive faster than the utility can deliver usable megawatts. |
| Industrial plant | Electrical gear, cooling, chillers, liquid loops, batteries, generators, fire systems and physical security. | This is where VRT, ETN, Schneider, ABB, Siemens, GE Vernova and construction specialists get pulled into the AI trade. |
| Compute stack | Accelerators, CPUs, memory, storage, servers, networking, orchestration, monitoring and support. | Cluster quality depends on the full system. Weak storage, networking or node-replacement processes can destroy useful GPU output. |
| Customer layer | Hyperscalers, AI labs, neoclouds, inference platforms and enterprises renting capacity. | The customer pays for time-to-compute and reliability. The provider earns the spread only after financing, depreciation, support and downtime. |
Why AI changes the old data-center model
AI training wants dense clusters with fast east-west networking, high uptime, large shared storage and enough cooling to run accelerators at high utilization. The facility becomes one machine. The operator who reduces setup time, downtime and debugging captures more value than the operator with the lowest headline GPU-hour price.
Where the bottleneck moves
The bottleneck starts with GPUs, then moves to HBM, networking, storage, power, cooling and operational goodput. Equity upside follows the layer with scarce supply and measurable pricing power. Equity downside appears when revenue growth requires too much debt, too much dilution or too much customer concentration.
This is why the memo focuses on connected power, active power, cluster quality and free-cash-flow capture. A headline gigawatt pipeline has value only after it becomes commissioned capacity that customers can use.
What Leopold's Sequencing Actually Says
The portfolio read is a revealed-preference version of the Situational Awareness essay. If frontier AI scaling moves from $10B clusters to $100B and eventually trillion-dollar cluster planning, the scarce input stops being a single chip SKU. It becomes the full conversion chain: power rights, land, grid interconnect, transformers, construction, GPUs, networking, storage, orchestration, reliability and contracted customers.
| Period | What changed | Disclosure | Memo read |
|---|---|---|---|
| Q3 2025 | First public hard turn into compute infrastructure. | CRWV $563M common, CORZ $362M, IREN $339M. | He bought scarce powered shells and AI-cloud operators before the consensus data-center basket fully formed. |
| Q4 2025 | Broadened from GPU rental to the whole bottleneck stack. | BE $876M, CRWV calls $774M, LITE $479M, SNDK $250M, IREN $329M. | Power, optical and storage became the next layer of the same compute scarcity trade. |
| Q1 2026 | Long physical bottlenecks, with large puts against crowded chip/platform winners. | BE $879M common plus calls, SNDK $724M common plus calls, CRWV $556M common plus calls, IREN $401M, CORZ $389M, APLD $320M; puts on SMH, NVDA, ORCL, AVGO, AMD and ASML. | The portfolio is long delivered capacity and hedged against valuation compression in the obvious AI winners. |
| May 2026 | Nebius appears through a post-quarter Schedule 13G. | 12.41M NBIS Class A shares, 5.6% beneficial ownership, event date 19 May 2026, filed 27 May. | The sequence culminates in a direct >5% stake in a full-stack AI factory operator, after a year of buying the lower layers. |
Treat the option rows as exposure separate from premium paid. The put book looks huge because the table reports standardized 13F exposure. The cleaner interpretation is a barbell: long scarce physical bottlenecks, hedge or short the crowded obvious AI equity layer.
Flow Read: Retail Or Institutional?
Institutions found the physical-infrastructure bottleneck first. Retail then helped turn the broad AI/tech complex into a high-gamma chase when calls came back in May 2026. The right comparison is the prior memory/storage flow: same AI bottleneck rotation, different layer of the stack.
| Question | Evidence | Timing | Critical caveat |
|---|---|---|---|
| Institutional first | The strongest evidence is filed money: Leopold/Situational Awareness and multi-strat 13F books both show real institutional participation before the retail options evidence gets loud. | The data-center step-up is visible by Q2-Q3 2025, then the Leopold sequence accelerates through Q4 2025, Q1 2026 and the May 2026 NBIS 13G. | 13F data is delayed, incomplete, and bad at showing intraday or post-quarter de-risking. |
| Retail is the accelerant | Cboe's May 2026 note shows retail call buying in the Mag 10 AI/tech complex back near Covid-era extremes, and Citadel Securities' market-structure work says retail participation remained structurally elevated into 2026. | The retail re-acceleration is clearest in May 2026 after the tech rally. Institutional accumulation came first. | The evidence is broad AI/tech options flow. Ticker-specific retail demand in CRWV, NBIS and IREN remains unproven. |
| Same family as memory, different vehicle | The memory trade was the earlier scarcity layer: HBM, DRAM, NAND/HDD and storage. The data-center trade is the next layer: delivered compute capacity, power, networking, storage, support and goodput. | Memory/storage exposure kept compounding into Q4 2025 and Q1 2026, while data-center exposure had a large Q2-Q3 2025 options step-up and stayed gross-heavy. | Underwrite neoclouds with a harsher checklist than memory stocks. Memory is cyclical supply pricing; data centers add debt, construction, customer concentration and commissioning risk. |
| Citadel Advisors is a trading signal | Citadel's Q1 2026 13F had large data-center, memory and infrastructure rows, but often with common, calls and puts at the same time. | The book confirms that the complex became tradeable institutional inventory. It provides weak evidence for a clean long-only view. | The 13F option value is reported exposure in the SEC table. It is separate from option premium paid or maximum downside. |
Data centers
Memory / storage
Retail
| Additional finding | Evidence | Critical read |
|---|---|---|
| Data-center gross peaked before the latest hype | Citadel's selected APLD/BE/CORZ/CRWV/IREN/NBIS basket rose from roughly $0.5B gross reported exposure in Q4 2024/Q1 2025 to $1.6B in Q2 2025 and $5.4B in Q3 2025, then fell to $4.2B in Q4 and $3.9B in Q1 2026. | Institutions arrived early. Q1 2026 confirms liquidity and tradability rather than a fresh all-in chase. |
| Memory/storage stayed bigger | Citadel's selected MU/SNDK/STX/WDC bucket grew from roughly $2.6B gross in Q4 2024 to $6.4B in Q3 2025, $10.8B in Q4 2025 and $18.5B in Q1 2026. | The market kept fighting over memory and storage while it added data-center exposure. Memory/storage remained the larger institutional battleground. |
| CRWV is a mixed Citadel signal | In Citadel's Q1 2026 table, CRWV showed about $102M common, $522M calls and $569M puts of reported exposure. | That profile reads like volatility, hedging, dispersion or market-making inventory. Directional conviction is weak. |
| NBIS is cleaner in Leopold than in Citadel | Citadel's Q1 2026 NBIS row had roughly $47M common, $383M calls and $191M puts. Leopold's post-quarter NBIS disclosure was a 12.41M-share Schedule 13G. | The 13G is the cleaner directional signal. Citadel's multi-strat options book is the liquidity signal. |
The actionable read: if data centers are now being treated as the next memory trade, the market is probably directionally right but too casual about the differences. Memory/storage winners can reprice on supply scarcity. Neocloud and data-center winners must also convert capital into connected power, working clusters, durable customer contracts and equity value after financing costs.
The Economic Model
In a shortage, capital rotates toward the most inelastic input. In 2023-2024 that input was NVIDIA accelerator supply. In 2025-2026 the bottleneck broadened to delivered clusters because useful work requires power, cooling, network fabric, storage and support.
- Scarcity rent: the owner of the bottleneck captures price above normal return until supply catches up.
- Time arbitrage: customers pay for months saved, beyond nominal GPU-hours.
- Goodput: a cheaper GPU-hour can be more expensive if uptime, setup, NCCL debugging and storage make researchers lose time.
- Capital-cycle risk: excess returns invite supply. If too many gigawatts arrive after demand normalizes, the same assets become commodity hosting.
The Critical Counterpoint
The bear case: public equities already capitalize the best version of the buildout while the true economics leak to NVIDIA, lenders, landlords, utilities, construction contractors and customers.
- Backlog creates a delivery obligation before it creates free cash flow.
- ARR turns into revenue after GPUs are delivered, commissioned and placed in service.
- Contracted power creates value after it becomes active, revenue-generating power.
- New GPU generations can strand older clusters faster than spreadsheet depreciation schedules assume.
- The neocloud can win the customer and still lose the equity economics if debt, leases or dilution absorb the return.
Situational Awareness, Quantified
Leopold is an economist modelling an industrial mobilization. Effective compute grows ~0.5 order of magnitude (OOM) per year from hardware plus ~0.5 OOM/yr from algorithms, so roughly 5 OOMs (100,000x) of effective compute by 2027 and ~10 OOMs this decade. Played forward, the largest training cluster scales +1 OOM every two years in chips and in power:
| Year | H100-equiv | Cluster cost | Power | % US electricity |
|---|---|---|---|---|
| 2022 | 10k | $0.5B | 10 MW | 0.0% |
| 2024 | 100k | ~$3B | 100 MW | 0.0% |
| 2026 | 1M | ~$22B | 1 GW | 0.2% |
| 2028 | 10M | ~$150B | 10 GW | 2.1% |
| 2030 | 100M | ~$1.0T | 100 GW | 20.6% |
The binding constraint is power, not chips: a 100 GW cluster is roughly 20% of US electricity generation. Total world AI investment scales alongside it, toward war-economy magnitudes:
| Year | Annual AI capex | % of US GDP |
|---|---|---|
| 2024 | $150B | 0.5% |
| 2026 | $500B | 1.7% |
| 2028 | $2.0T | 6.9% |
| 2030 | $8.0T | 27.6% (WWII US war prod ≈ 50%) |
The investable inference: if power is the binding constraint, the scarcity rent (Ricardian rent on the limiting factor) accrues to whoever controls secured, energized power - exactly the long leg of the barbell, and the axis on which CoreWeave, Nebius and IREN must be judged.
models/situational_awareness_scaling.py. Source: Racing to the Trillion-Dollar Cluster and the Dwarkesh Patel interview. Cluster cost grows slower than chips/power because FLOP/$ keeps improving (~22%/yr here, calibrated to ~$1T by 2030).Who Actually Has Clusters?
| Company | What is real now | What must happen | Critical read |
|---|---|---|---|
| CoreWeave | Q1 revenue of $2.078B, adjusted EBITDA of $1.157B, revenue backlog of $99.4B, more than 1GW active power and more than 3.5GW contracted power. | A path to more than 8GW by 2030, continued backlog conversion, and enough customer diversification to reduce hyperscaler/foundation-lab renegotiation risk. | Best live operator. But the equity is a levered residual claim: Q1 interest expense was $536M and total liabilities were $50.8B. |
| Nebius | Q1 Nebius AI Cloud revenue of $390M, $9.3B cash, $6.3B capital secured, Microsoft/Meta/NVIDIA validation, and more than 3.5GW contracted capacity with more than 75% owned. | 800MW-1GW connected power by year-end 2026; Missouri, Pennsylvania, Finland and other sites must move from contracted/under construction to connected and active. | Best strategic asset if it executes. The stock is already pricing a lot of the 2027-2030 success path. |
| IREN | $9.7B Microsoft contract, $3.4B NVIDIA AI Cloud contract, 5GW NVIDIA-aligned partnership, 480MW 2026 expansion plan, $3.1B ARR under contract, and $2.6B cash as of 30 Apr. | The big AI-cloud fleet must become revenue-generating capacity; IREN explicitly says contracted ARR depends on GPUs delivered, commissioned and in service. | Most asymmetric and most fragile. It is a power-to-GPU conversion story until it proves production-grade cluster quality. |
Revenue Growth: Scale Versus Transition
Revenue quality separates the three names. CoreWeave is already doing more than $2B per quarter, which makes it the most proven operating company in the peer set. Nebius has the highest total revenue growth rate and narrowly leads IREN on AI-cloud growth. IREN's AI-cloud growth is explosive, but it starts from a small base while total revenue is still pressured by the bitcoin-mining transition.
| Company | Latest quarter | Total revenue | Total YoY | Total QoQ | AI-cloud / AI-infra revenue | AI-cloud YoY | Memo read |
|---|---|---|---|---|---|---|---|
| CoreWeave | Q1 2026 | $2.078B | +111.6% | +32.2% | $2.078B | +111.6% | Scale leader. More than 5x Nebius revenue and more than 14x IREN total revenue. |
| Nebius | Q1 2026 | $399.0M | +684% | +75.2% | $390M | +841% | Fastest total-revenue grower and narrowly the fastest AI-cloud grower. |
| IREN | Q3 FY26 | $144.8M | -2.2% | -21.6% | $33.6M | +833% | Fastest transition story. AI cloud is ramping from a tiny base while bitcoin mining revenue falls. |
Latest Quarterly Total Revenue
CoreWeave has the only scaled revenue base today.
Total Revenue YoY Growth
Nebius wins the clean growth-rate comparison.
AI-Cloud / AI-Infra Revenue
IREN is still early; Nebius is much closer to CoreWeave scale.
AI-Cloud / AI-Infra YoY Growth
Nebius barely beats IREN; both are moving off very different bases.
Revenue ranking
IREN read-through
Unit Economics: Why Goodput Beats Sticker Price
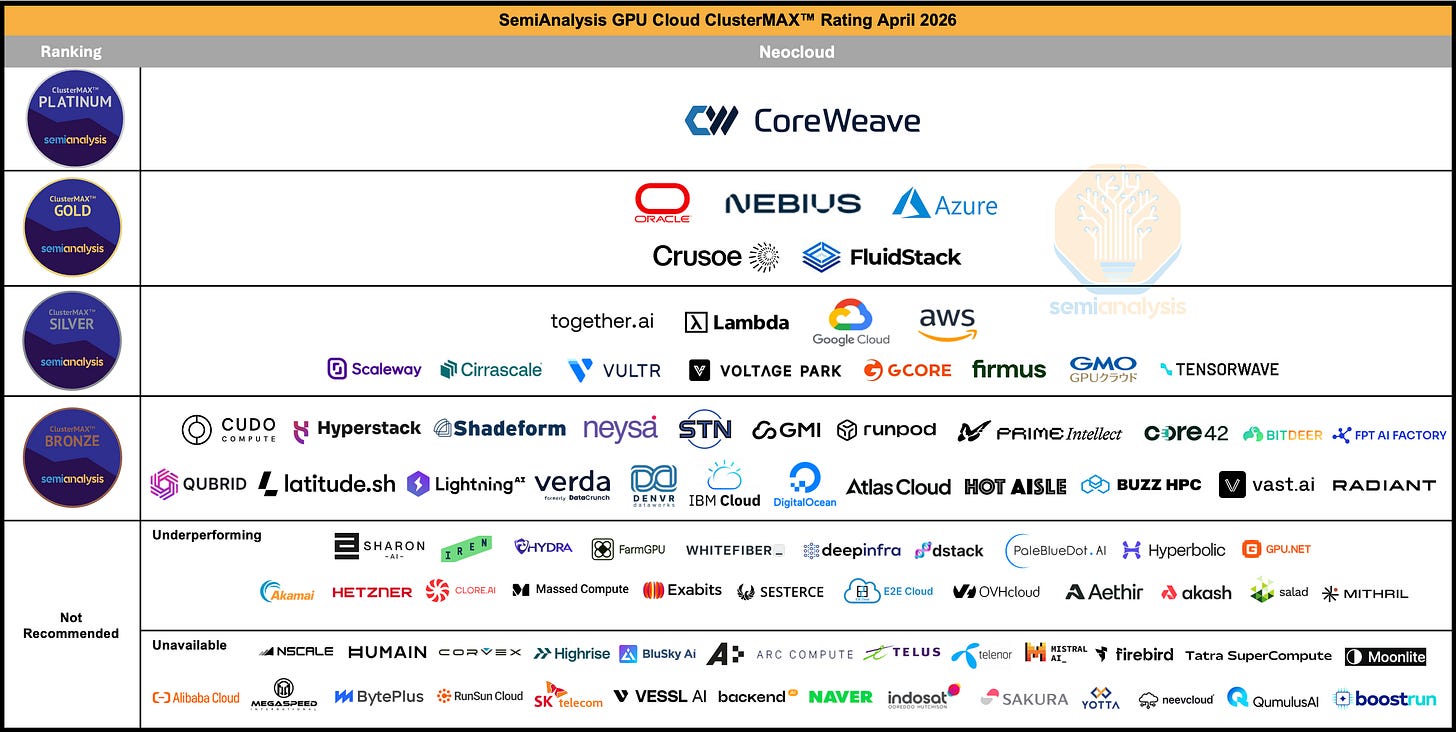
SemiAnalysis's ClusterMAX/TCO work is the right framework: useful work per dollar matters more than headline GPU-hour price. Downtime, setup time, debugging, storage, networking, orchestration and support determine the customer's real cost. That is why CoreWeave can plausibly command a premium while a cheaper underperforming provider can still be expensive.
| Scenario | Useful $/GPU-hr | Useful revenue | EBITDA | Fixed burden | Residual |
|---|---|---|---|---|---|
| CoreWeave-like live operator | $3.21 | $1.34B | $748M | $2.14B | -$1.40B |
| Nebius-like owned pipeline | $3.13 | $1.10B | $462M | $520M | -$58M |
| IREN-like commissioning ramp | $3.27 | $803M | $289M | $460M | -$171M |
| Cheap bad cluster | $3.46 | $535M | $161M | $360M | -$199M |
This model is a capital-discipline check. It assumes 72,000 GPUs, 8,760 annual hours, provider-level utilization, realized goodput, EBITDA margin, and debt or lease costs. The point is simple: cheap headline GPU capacity is not cheap if the cluster underperforms, and large revenue scale does not create equity value if fixed financing costs absorb the economics.
Who Captures The Rent? Depreciation vs Price Erosion
The goodput model above asks what the customer pays. This asks what the equity keeps. A 100 MW cluster is roughly 71,400 GPUs and about $4.4B of all-in capex (~73% GPUs, ~27% datacenter). At a booked 6-year life and $2.90/GPU-hr it throws off an 83% EBITDA margin - which is exactly why neoclouds quote EBITDA. But the GPU's true cost (depreciation) and the debt that bought it (interest, ~24% of EBITDA here) are fixed dollars, so net margin has brutal operating leverage.
Interactive: who captures the rent? (100 MW reference cluster)
EBITDA margin barely moves. Net income and FCFE collapse as the GPU's economic life shortens or rental price erodes, because depreciation and interest are fixed dollars. Drag the sliders.
Depreciation is the GPU's real cost
| GPU life | Deprec./yr | EBITDA mgn | Net mgn |
|---|---|---|---|
| 2 yr (Burry view) | $1.53B | 83.0% | -30.4% |
| 3 yr | $1.04B | 83.0% | -0.8% |
| 4 yr | $0.80B | 83.0% | +13.9% |
| 5 yr | $0.66B | 83.0% | +22.8% |
| 6 yr (CoreWeave books) | $0.56B | 83.0% | +28.7% |
Rental-price erosion (6yr life)
| $/GPU-hr | Revenue | Net mgn | FCFE |
|---|---|---|---|
| $3.50 (frontier) | $1.97B | +38.7% | +$0.83B |
| $2.90 (base) | $1.63B | +28.7% | +$0.55B |
| $2.20 | $1.24B | +10.1% | +$0.20B |
| $1.60 | $0.90B | -18.7% | -$0.10B |
| $1.10 (aged) | $0.62B | -66.7% | -$0.34B |
The Michael Burry vs CoreWeave fight in one number: CoreWeave books GPUs over ~6 years; bears argue the economic life is 2-3 years once the next NVIDIA generation ships. At a 3-year life net margin falls to roughly breakeven; at 2 years it is -30%. A price drop to $1.60/GPU-hr alone takes net margin to -19% even at the generous 6-year life - and FCFE turns negative in either bear case, so the cluster cannot self-fund its own GPU refresh. The rent gets eaten by NVIDIA (depreciation) and lenders (interest) before it ever reaches common equity.
models/gpu_cluster_economics.py (pure standard library). Complements the goodput model above; parameters triangulated from SemiAnalysis and ClusterMAX. A model, not a forecast.CoreWeave
Nebius
IREN
Scoring The Three
Has The Move Been Priced In?
Partly, yes. The first-order trade - buy anything with AI data-center exposure - is mature. The second-order trade is still alive: distinguish delivered, high-goodput capacity from contracted-but-unconnected capacity, and distinguish enterprise value creation from common-equity value capture.
- CoreWeave: operating quality is priced; balance-sheet fragility may still be underpriced by bulls.
- Nebius: strategic quality is increasingly priced after the 13G signal; execution timing is the swing factor.
- IREN: optionality is priced more than proven cloud quality; the next rerating requires third-party cluster-quality evidence.
Priced In, Quantified: EV Per Contracted GW
The cleanest Leopold-style multiple is enterprise value per unit of the binding constraint - EV per contracted GW. It reframes the “IREN is cheap” story:
| Company | EV (approx) | EV / contracted GW | Read |
|---|---|---|---|
| Nebius | $53.7B | $13.4B | Cheapest per contracted GW; net cash; below even base-case fair value. |
| CoreWeave | $68.7B | $19.6B | Live leader; below the bull bottoms-up value, so not pricing perma-bull. |
| IREN | $20.2B | $26.9B | Dearest per contracted GW; cheap only if the ~5 GW pipeline converts. |
Benchmark that against a bottoms-up fair equity value per GW - capitalizing the cluster model's steady-state FCFE at a 15% cost of equity:
| Scenario | Fair equity value / GW |
|---|---|
| Bull - 6yr life, $2.90/GPU-hr held | $36.6B |
| Base - 5yr life, $2.50/GPU-hr | $17.1B |
| Bear-ish - 4yr life, $2.20/GPU-hr | -$2.4B |
| Bear - 3yr life, $1.60/GPU-hr | -$38.0B |
A GW of perfectly contracted, 6-year-life, $2.90/GPU-hr cluster is worth ~$37B of equity bottoms-up. CoreWeave ($19.6B/GW) and Nebius ($13.4B/GW) trade below that heroic figure, so the market is not pricing the perma-bull case - it sits between the base ($17.1B) and bull bands, and Nebius is the only one below even base-case fair value. IREN is the most expensive per contracted GW; it looks cheap only if you credit its ~5 GW secured-power pipeline converting to contracted cash flow. That is a real option - but priced as one, with the operator-quality proof gap on top.
models/priced_in.py. Market data ~31 May 2026 (approximate); net debt and contracted-GW are estimates - the value is the relative comparison and the framework, not false precision.What Would Change My Mind
CoreWeave upgrade trigger
Nebius upgrade trigger
IREN upgrade trigger
Final stance: NBIS is the strategic compounder, CRWV is the live-scale operator with a financial-structure penalty, and IREN is the high-beta execution option. The investable edge is discriminating between power, connected power, active power, goodput and free-cash-flow capture.