Market Framework
Markets Are Power-Law Machines
Buying the biggest companies beat the index for 30 years. Cranking up the concentration did not.
7 June 2026 · YK Research
Contents
Executive Summary
One question drove this test: if a handful of companies capture most of the market's wealth creation, what happens if you buy only the biggest ones instead of the whole S&P 500?
The leaders won. A point-in-time basket of the ten largest US companies, re-picked each year and equal-weighted, compounded at 12.44% over 30 years versus 10.15% for SPY. That is 2.3 points a year for three decades. The same basket also beat SPY over the trailing 10- and 20-year windows.
The surprise is what concentration did not do. Narrowing to the Top 3 compounded at 12.15% over 30 years, slightly below the Top 10, with a deeper 64% drawdown. More concentration bought more pain, not more return. The reward for owning the leaders is real; the reward for owning only the very biggest is not.
Against the tougher benchmark, QQQ, the picture splits: the Nasdaq-100 beat the baskets over 20 years but trailed over 30, and took an 83% drawdown getting there. The basket is not just tech beta in disguise, a question the QQQ section takes head on.
The Backtest
Re-pick the biggest companies each year from the rankings as they stood then, not as they stand today. That point-in-time step is the whole game: buying today's winners backward through time would be survivorship bias, not evidence.
- At the start of each year, rank US companies by point-in-time market cap.
- Buy the Top 3, Top 5, or Top 10.
- Equal-weight the names.
- Rebalance once a year.
- Compare against SPY and Berkshire Hathaway.
What It Measures
This is a test of market concentration: does public-equity wealth creation keep flowing into the largest platforms and cash-flow machines? It is deliberately crude so the result is hard to fake.
- It ranks by point-in-time market cap, never by a backward-filled list of today's winners.
- It uses an approximate US-company universe, not official S&P 500 membership.
- It uses Yahoo adjusted closes for prices, SPY, and BRK-B.
- It ignores tax, turnover cost, slippage, and capacity.
Data and Methodology
Data Used
- The universe is a reconstructed point-in-time Top 10 by market cap for each year from 1996 to 2026: the giants as they ranked then, GE, Exxon, Citi, Cisco, Intel, Pfizer, and AIG in the early years, today's megacaps in the later ones.
- Daily split- and dividend-adjusted closes come from Yahoo Finance, so each name's held-year return is a true total return.
- SPY and BRK-B are Yahoo adjusted closes. SPY's adjusted series reinvests dividends, so it is effectively a total-return benchmark.
- The test uses market-cap rank, not official S&P 500 index membership.
Portfolio Construction
- At the start of each year, take that year's ranked Top 10 and keep the names with tradable price data.
- Equal-weight the basket. A Top 5 basket starts the year at 20% per name.
- Hold those weights through the year, then re-rank and rebalance at the next year-start.
- The daily equity curve compounds the equal-weighted daily returns.
Why annual rebalance
Annual rebalancing lets a winner run for a year before it is trimmed back to its target weight. Rebalance too often and you systematically sell your winners. The frequency is not a detail; it moves the result by points a year, as the rebalance section shows.
Why equal-weight
A cap-weighted Top 5 would just be the largest one or two names. Equal-weight asks the cleaner question: does the leadership group work, or did a single winner carry the whole result?
Main limitation
One historical path, the greatest megacap era in US history, with an imperfect universe that undercovers delisted and acquired former giants. The benchmarks reproduce the tape to about 0.1 point a year, which is the main check that the engine is sound. Treat this as directional research, not a CRSP-grade backtest.
Results
Every basket of leaders beat SPY over all three windows. I add QQQ (the Nasdaq-100) as a second benchmark, because a megacap basket is partly a tech-growth bet and QQQ is the tougher, more honest comparison. The ordering inside the baskets is the interesting part, and it flips with the horizon.
10 Years
| Basket | CAGR | Max DD | Sharpe |
|---|---|---|---|
| Top 3 | 24.67% | -35.34% | 0.91 |
| Top 5 | 24.51% | -45.92% | 0.90 |
| Top 10 | 21.44% | -37.44% | 0.88 |
| QQQ | 21.23% | -35.12% | 0.87 |
| SPY | 15.18% | -33.72% | 0.75 |
| BRK-B | 13.16% | -29.57% | 0.62 |
20 Years
| Basket | CAGR | Max DD | Sharpe |
|---|---|---|---|
| QQQ | 16.51% | -53.40% | 0.73 |
| Top 5 | 15.41% | -49.06% | 0.67 |
| Top 10 | 13.96% | -46.77% | 0.66 |
| Top 3 | 13.84% | -52.54% | 0.60 |
| SPY | 11.22% | -55.19% | 0.56 |
| BRK-B | 10.94% | -53.86% | 0.52 |
30 Years
| Basket | CAGR | Max DD | Sharpe |
|---|---|---|---|
| Top 10 | 12.44% | -57.80% | 0.55 |
| Top 5 | 12.37% | -67.75% | 0.52 |
| Top 3 | 12.15% | -64.16% | 0.50 |
| BRK-B | 10.91% | -53.86% | 0.48 |
| QQQ* | 10.81% | -82.96% | 0.44 |
| SPY | 10.15% | -55.19% | 0.48 |
Over 30 years the Top 10 led at 12.44%, beating SPY by 2.29 points a year with a higher Sharpe (0.55 vs 0.48). Over 10 years the order reverses: the Top 3 led at 24.67% and the Top 10 trailed the tighter baskets. Concentration helped recently; the broad-leaders basket won the long game.
QQQ is the sterner test, and it splits the decision. Over 20 years QQQ actually beat every equal-weight basket (16.51% vs the Top 5's 15.41%), because the Nasdaq-100 is itself a concentrated tech-leader bet. But it paid in risk: an 83% max drawdown in the dot-com bust, the deepest hole on the page. Over 30 years the baskets retake the lead on return and crush QQQ on drawdown (-58% for the Top 10 vs -83%). The next section unpacks that trade-off.
* QQQ launched in March 1999, so its 30-year figures cover ~27 years since inception. The -83% drawdown is the 2000–2002 Nasdaq collapse, which QQQ caught in full.
The Edge Is Front-Loaded Into the Last Decade
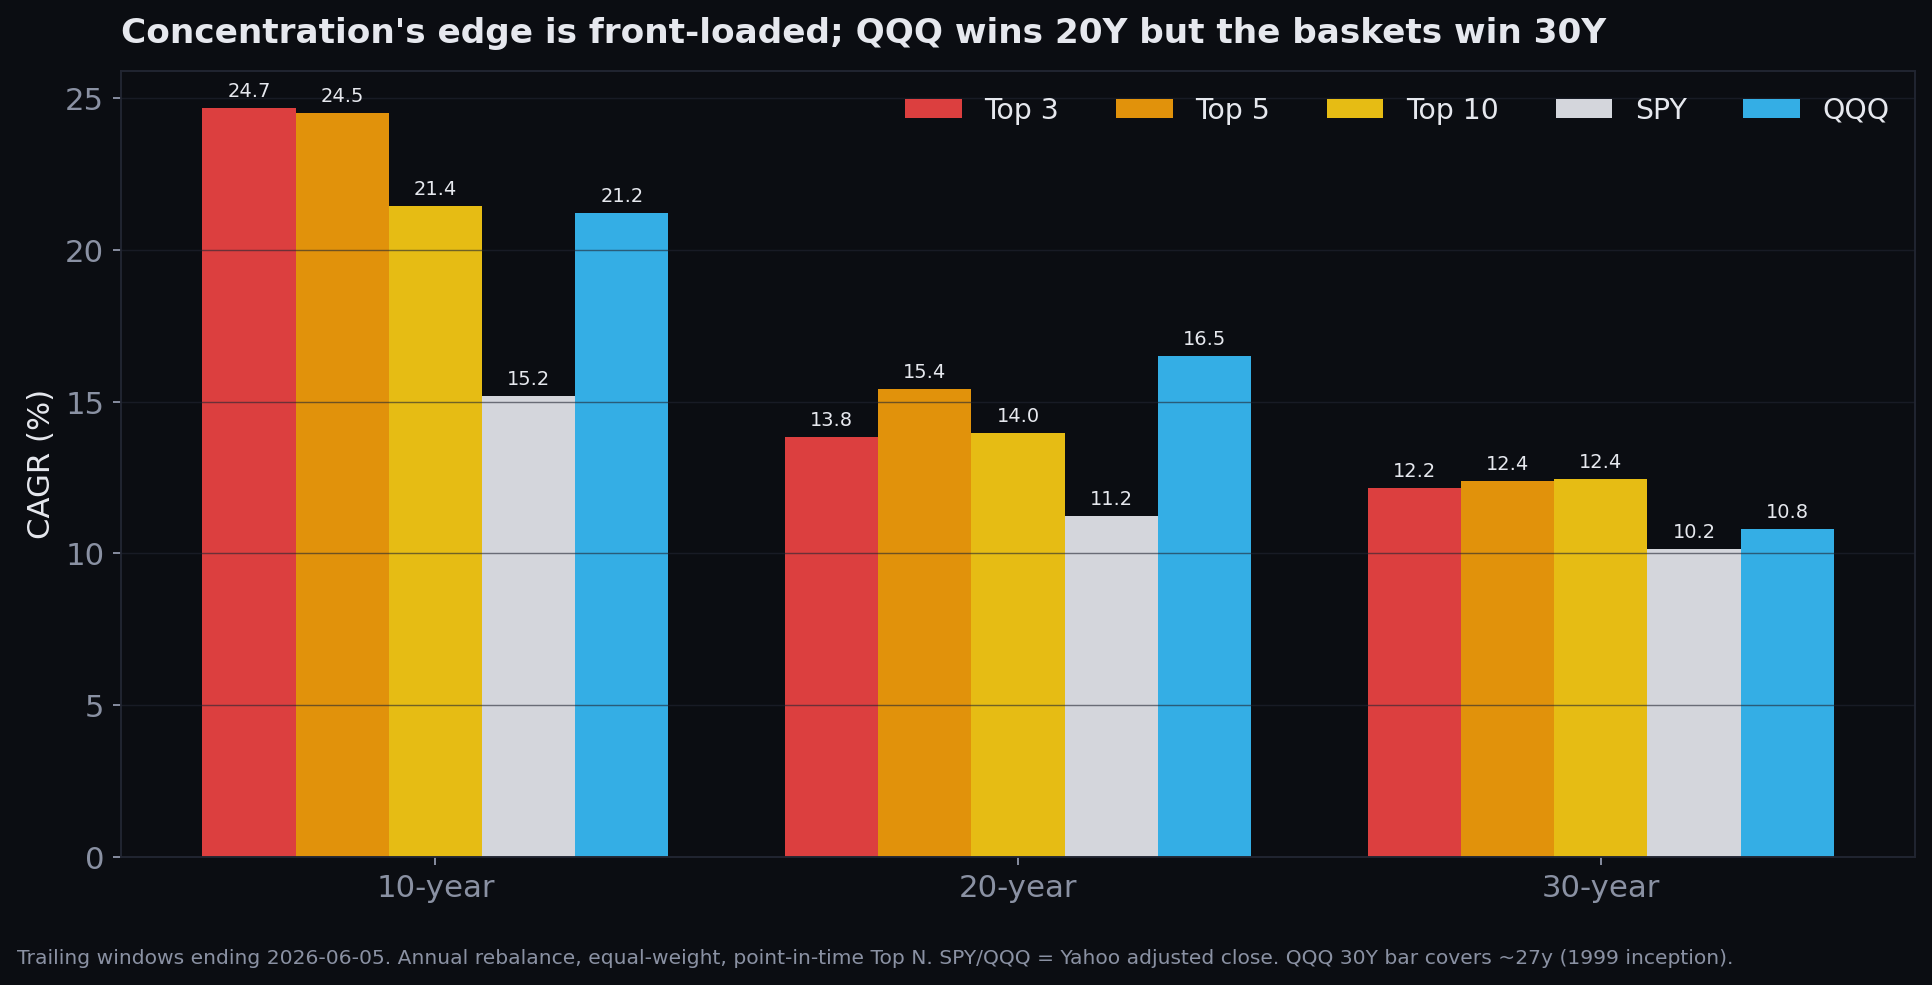
Read the chart left to right and the story is clear. Over ten years the tightest basket wins by a mile, 24.7% for the Top 3 against 15.2% for SPY. Stretch the window to thirty years and the baskets converge, with the broad Top 10 nosing ahead. Concentration's big premium belongs to the recent decade, powered by the AI and megacap-platform era. The longer the lookback, the more an ordinary year-after-year edge does the work. QQQ tracks the same shape, winning the 20-year window before the baskets reclaim the 30-year one.
30-Year Growth of $1
More Concentration Did Not Pay Over the Long Run
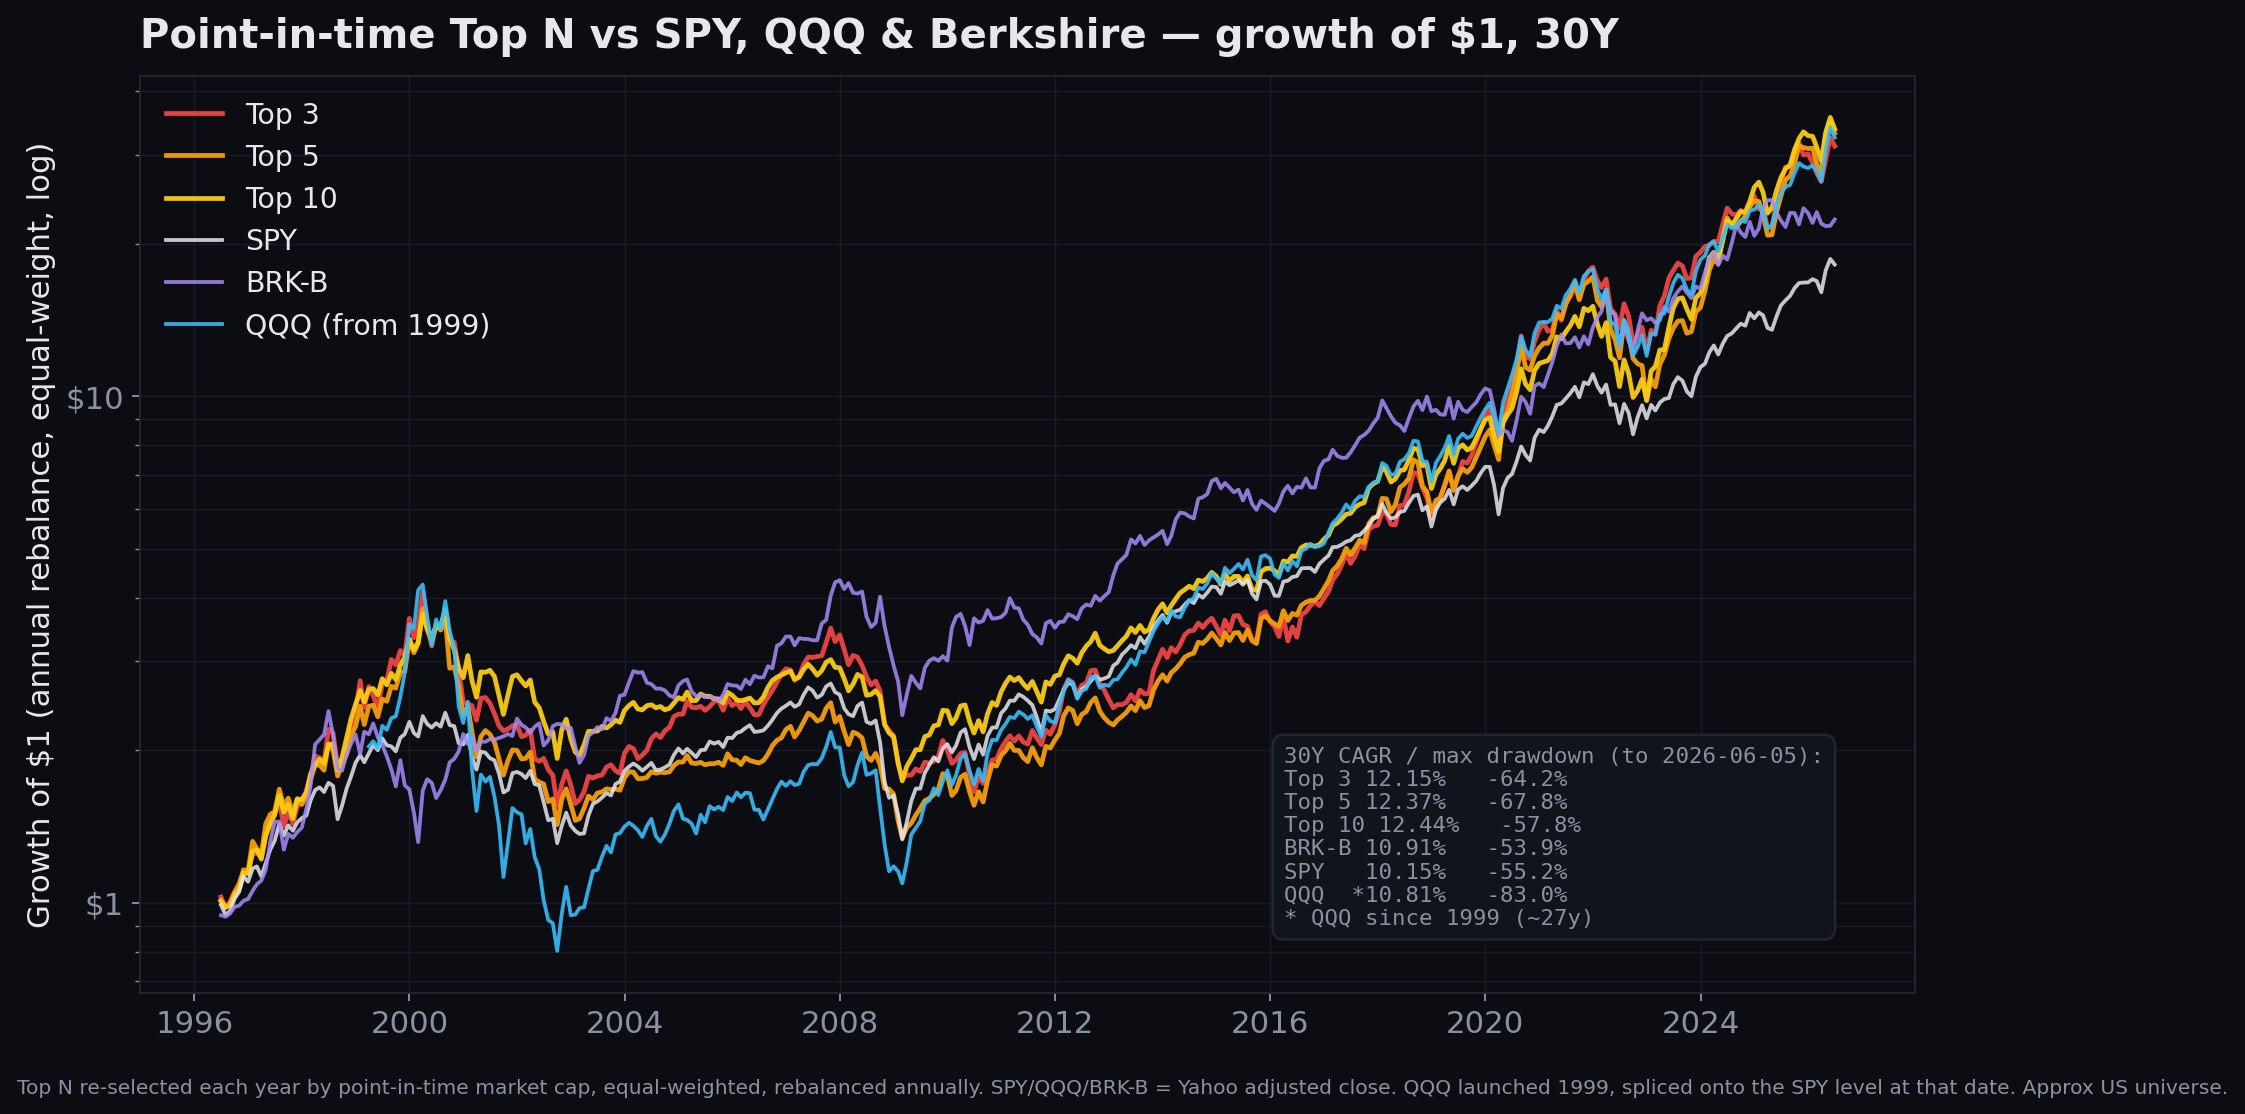
The instinct is that a tighter basket should compound faster, because you are holding only the very best. The 30-year numbers say otherwise. The Top 3 returned 12.15% with a 64% drawdown. The Top 10 returned 12.44% with a 58% drawdown. You gave up return and took more pain to own fewer names.
The mechanism is simple. The single largest company in any era is often the most expensive, the most crowded, and the heaviest single-name risk. Microsoft in 2000, GE through the 2000s, and the megacaps in 2022 each dragged a tight basket through a brutal stretch. Widening to ten names keeps the leadership exposure while diluting the blow-up risk of any one giant. Inside the leaders, breadth helped both return and drawdown over thirty years.
How Often You Rebalance: Annual vs Quarterly vs Monthly
The base case rebalances once a year. The obvious alternatives are to re-rank and re-equal-weight every quarter or every month, keeping the basket tighter to the live leaderboard. So here is each basket run all three ways, over 30 years, where the difference bites hardest.
The result is monotonic: the more often you rebalance, the lower the return. Each reset trims whatever has run and tops up whatever has lagged, so frequent rebalancing is a steady anti-momentum tax. Annual lets winners run for a full year, quarterly clips them four times, monthly twelve. Over 30 years annual and quarterly still beat SPY; monthly does not.
Top 3, 30Y
| Rebalance | CAGR | Max DD | Sharpe |
|---|---|---|---|
| Annual | 12.15% | -64.16% | 0.50 |
| Quarterly | 11.10% | -65.47% | 0.47 |
| Monthly | 9.52% | -65.27% | 0.41 |
| SPY | 10.15% | -55.19% | 0.48 |
| QQQ | 10.81% | -82.96% | 0.44 |
Top 5, 30Y
| Rebalance | CAGR | Max DD | Sharpe |
|---|---|---|---|
| Annual | 12.37% | -67.75% | 0.52 |
| Quarterly | 11.37% | -69.72% | 0.49 |
| Monthly | 9.78% | -68.04% | 0.43 |
| SPY | 10.15% | -55.19% | 0.48 |
| QQQ | 10.81% | -82.96% | 0.44 |
Top 10, 30Y
| Rebalance | CAGR | Max DD | Sharpe |
|---|---|---|---|
| Annual | 12.44% | -57.80% | 0.55 |
| Quarterly | 11.46% | -62.11% | 0.51 |
| Monthly | 10.05% | -60.28% | 0.46 |
| SPY | 10.15% | -55.19% | 0.48 |
| QQQ | 10.81% | -82.96% | 0.44 |
Horizon matters. Over 10 and 20 years all three schedules beat SPY, because the recent decade was strong enough to cover the rebalance drag (10Y monthly Top 3 still compounds at 21.3% vs SPY's 15.2%). The gap only turns into underperformance at 30 years, and only for monthly. The lesson generalizes past this study: in a momentum-heavy, power-law basket the rebalance schedule can matter more than the basket size. Annual is the better default. Let winners run.
Both index benchmarks sit in the same 10% range over 30 years (SPY 10.15%, QQQ 10.81% since its 1999 start), so even monthly rebalancing is roughly a coin flip against the indices. Annual and quarterly clear both comfortably. Note QQQ's -83% drawdown: the index alternative to a managed basket came with its own brutal hole.
How the Index Itself Does It: Cap-Weight vs Equal-Weight
One more honest comparison: SPY does not equal-weight anything. The S&P 500 is float-adjusted market-cap weighted, so a company's weight is just its size, and weights drift up with price on their own. The index only does light quarterly maintenance to refresh share counts, and a committee decides additions and deletions on size, liquidity, and profitability rules. Cap-weighting is itself a let-winners-run machine: when a megacap rips, its weight grows automatically and the index never trims it.
So what happens if you run the Top 10 the way the index runs itself, cap-weighted and rebalanced quarterly? It still beats SPY. Over 30 years the most index-faithful version compounds at 11.1% against SPY's 10.2%. The "own the leaders" edge survives even when you strip out the equal-weight tilt.
| Top 10 build | 30Y CAGR | Max DD | Sharpe |
|---|---|---|---|
| Equal-weight, annual (base case) | 12.44% | -57.80% | 0.55 |
| Cap-weight, annual | 12.05% | -60.41% | 0.53 |
| Cap-weight, quarterly (most SPY-like) | 11.09% | -64.62% | 0.49 |
| QQQ (Nasdaq-100, ~27y) | 10.81% | -82.96% | 0.44 |
| SPY (the index) | 10.15% | -55.19% | 0.48 |
Two things stand out. First, every version of the Top 10 beats the index, including the cap-weighted, quarterly one that mirrors SPY's own mechanics. Second, equal-weight annual is still the best build: cap-weighting pours money into the #1–2 names, which carry the heaviest single-name risk, so it gives up return and takes a deeper drawdown than spreading evenly across all ten. One caveat: with only year-start market caps, the cap-weight here resets to those each rebalance, which slightly overstates the trimming drag versus a true float index that lets weights drift. A real float-cap Top 10 would land a touch higher, around 11.5%, still above SPY.
Is This Just QQQ?
The obvious objection: a basket of the biggest companies is mostly big tech, so maybe this is just the Nasdaq-100 in a trench coat. The QQQ rows test that directly, and the answer is no, with a caveat worth respecting.
The caveat first. Over 20 years QQQ beat every equal-weight basket, 16.51% against the Top 5's 15.41%. The Nasdaq-100 is itself a concentrated leader bet, and through the post-2009 tech run it expressed that bet more aggressively than a rebalanced top-cap basket did. If your window is the last two decades, QQQ won outright on return.
Now the difference. QQQ paid for that return with an 83% drawdown in 2000–2002, because it is wall-to-wall tech and caught the dot-com bust with no ballast. The point-in-time top-cap basket is not pure tech: across its history it held Exxon, GE, Berkshire, Walmart, J&J, JPMorgan, Procter & Gamble, and Pfizer alongside the platforms. That mix is why its worst drawdown was 58%, not 83%, and why over the full 30 years it beat QQQ on return (12.44% vs 10.81%) and on Sharpe (0.55 vs 0.44).
So the effect overlaps with tech beta but is not the same thing. What the test isolates is the power law of size, and the largest companies are not always the tech ones. Owning the biggest names, whatever sector they sit in, gave most of QQQ's upside with materially less of its dot-com-style wipeout risk. The edge is concentration in proven leaders, not a single sector.
A Trend Overlay Buys Survival, Not Alpha
The 58% drawdown on the Top 10 is the real obstacle. It is a forced-sale machine for anyone with leverage, redemptions, or weak conviction. A basic trend rule will not create the edge, but it can make the edge survivable.
The overlay watches the basket's own equity curve and scales exposure up or down. Idle cash earns the 13-week T-bill.
Normal regime
Above the 200-day moving average, stay fully invested. If the basket is overbought near a new high, trim to 80%.
Broken trend
Below the 200-day moving average, cut to 50%. Keep dry powder while the trend is damaged.
Panic add-back
Below the 200-day average, down more than 20% from the one-year high, and RSI(14) under 40, raise back to 85%. Lean in when the selling is exhausted.
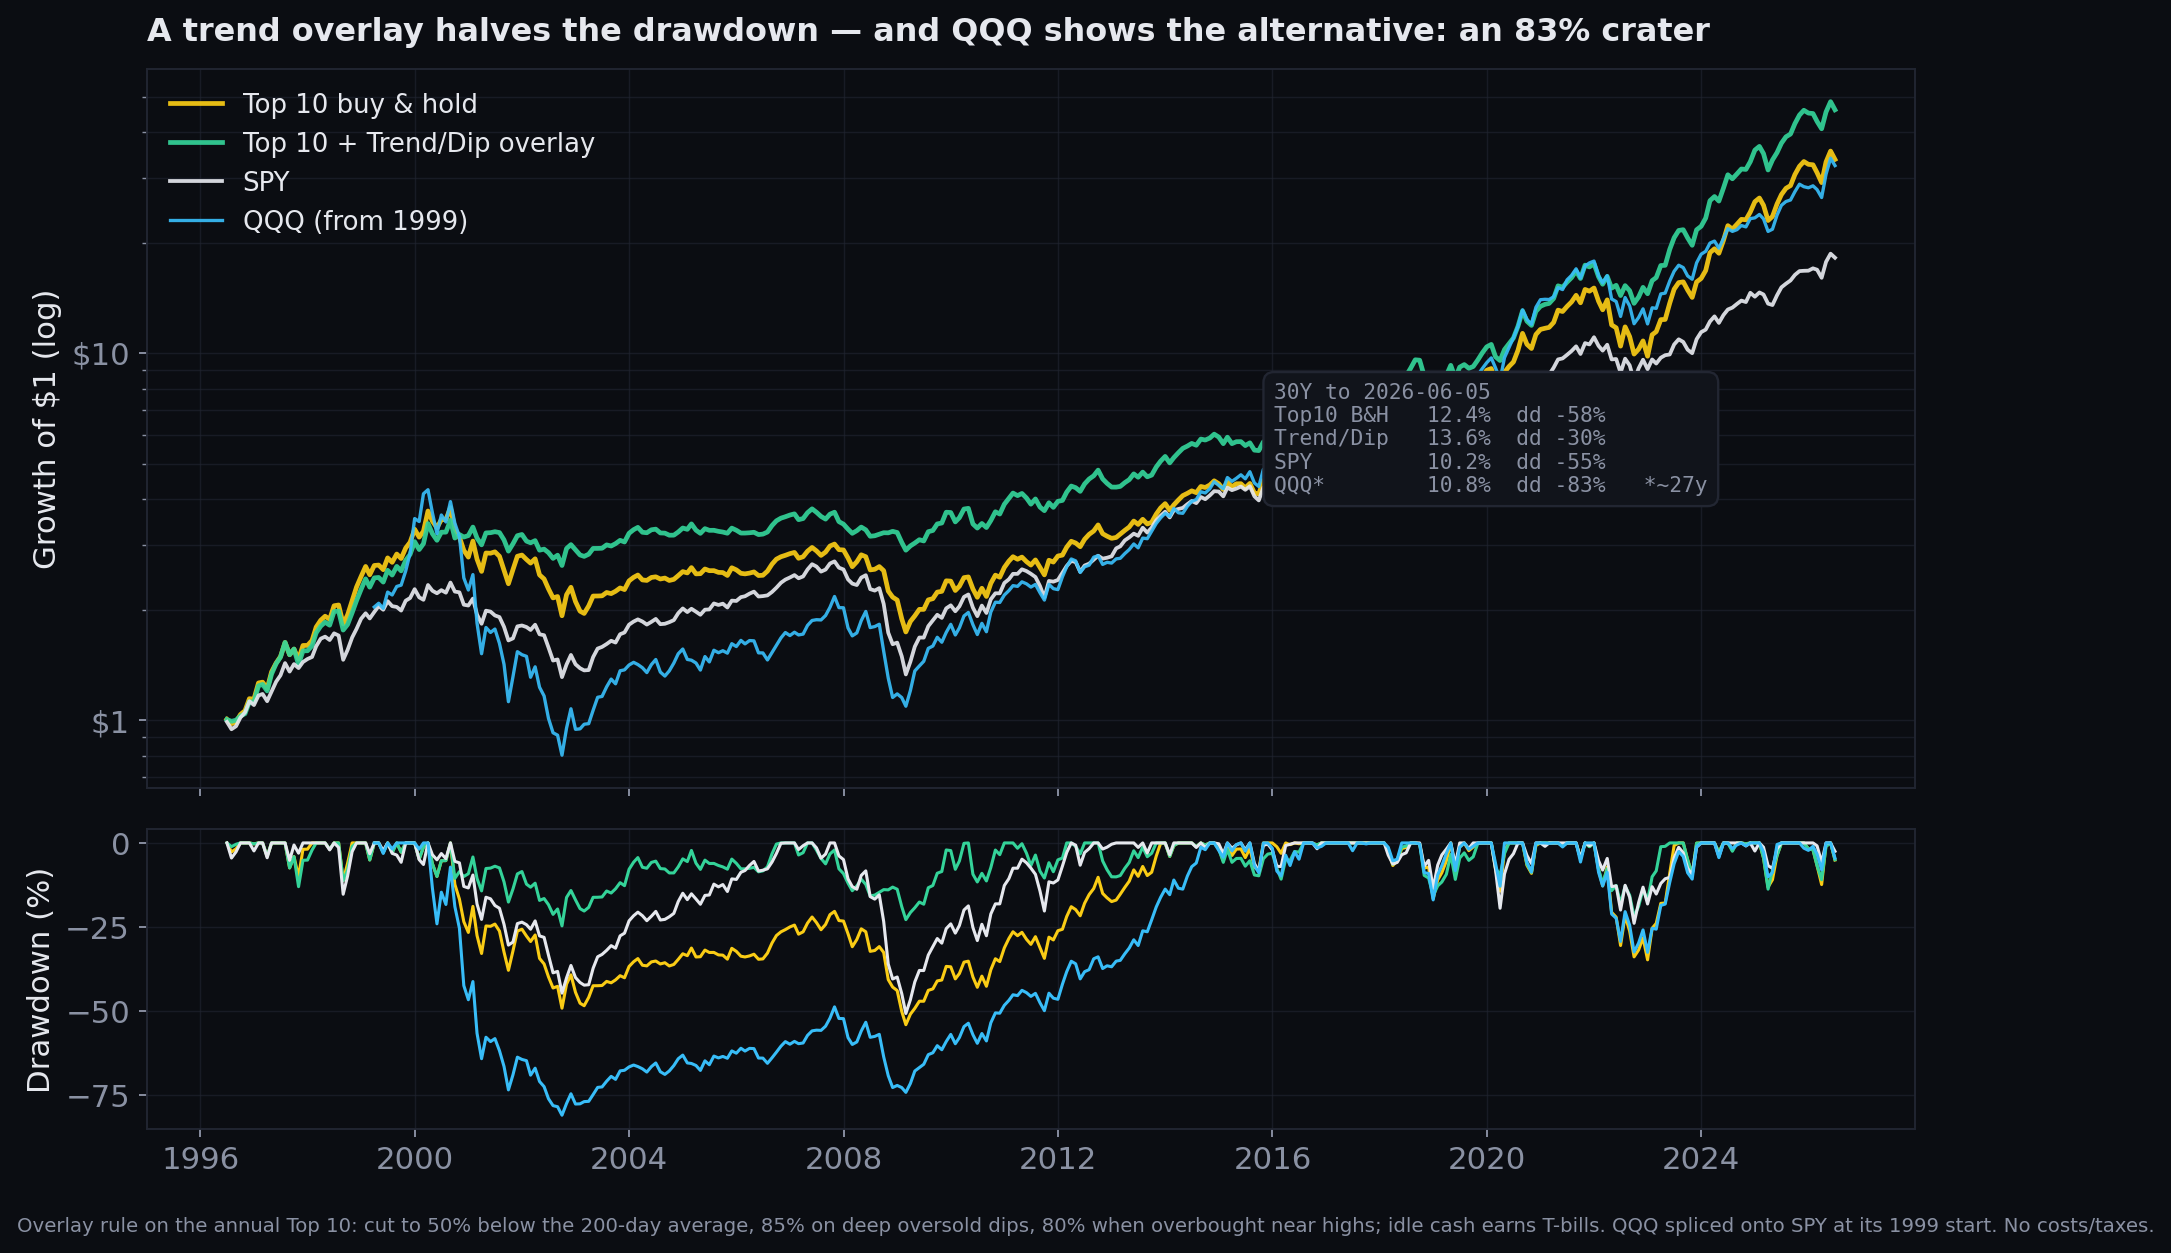
The overlay roughly halved the worst drawdown, from 58% to 30%, while keeping pace on return. Treat the return pickup with suspicion: a three-rule timing overlay tuned on one historical path is easy to overfit, and the honest claim is the drawdown cut, not the extra point of CAGR. The edge is still ownership of the leaders. The overlay is a seatbelt.
Why the Leaders Keep Winning
Why would the market pay you to own the largest companies? Structural concentration, through four reinforcing channels.
Scale economies
The largest firms buy inputs cheaper, distribute wider, hire better, and spread fixed costs across global revenue. Scale compounds into margin and resilience.
Winner-take-most markets
Software, ads, cloud, networks, semis, and payments reward the category leader with data, distribution, cash flow, and optionality. The lead feeds itself.
Institutional demand
Large funds need liquidity, and only the biggest names can absorb their flows. Passive indexing also pushes fresh capital into the largest weights every month.
Selection by survival
A company does not reach the top by accident. It has already beaten prior cycles, competitors, capital markets, and execution shocks to get there.
The market pays to own scarce, dominant cash-flow compounders as long as the economy keeps rewarding scale. That is the edge. The backtest is evidence of the effect, not a license to chase it blind.
Concentration Charges Rent
The drawdowns are the rent. Even the broad Top 10 fell 58% at its worst, and the Top 3 fell 64% for less return. A drawdown that deep ends the trade for anyone who has to sell into it.
- A tight basket concentrates business-cycle risk.
- It concentrates valuation risk in the most expensive names.
- It concentrates regulatory and political risk.
- Near a cycle peak it quietly becomes a momentum trade.
What Breaks It
The trade fails when the biggest companies stop earning their size. Size turns into bureaucracy, dominance invites regulation, and a high multiple turns a good company into a bad stock.
- Leadership rotates from growth platforms to cheap laggards.
- Rates rise and compress megacap multiples.
- Regulators attack the profit pool.
- The leaders crowd into a single theme, and the theme cracks.
Takeaway
Markets do not spread returns evenly. They route most of the gains into a small group of leaders, and over thirty years owning that group beat the index by more than two points a year.
But the obvious move, concentrating harder into the top three, did not pay. It delivered less return and a deeper hole. The sweet spot was the broad leaders, rebalanced once a year, held through the drawdowns.
That is the process lesson. If you tilt toward the leaders, you need rules: enough breadth to survive a single-name blow-up, the patience to let winners run instead of trimming them monthly, the drawdown tolerance to hold a 50%-plus fall, and a clear reason the leaders should keep earning their lead.